Government · cybersecurity · 2026
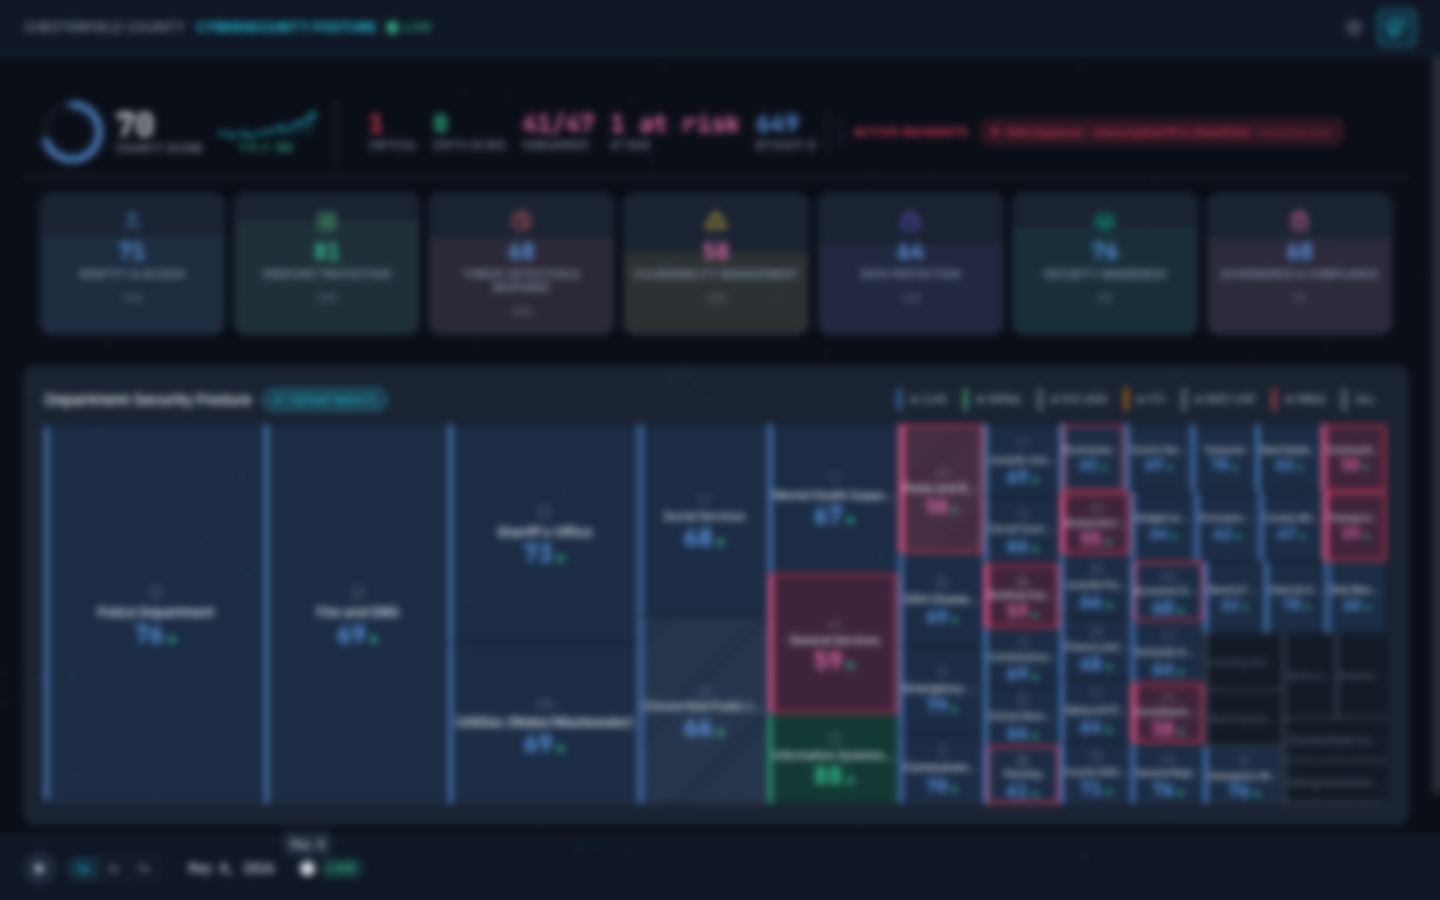
This dashboard shows a U.S. county government its security posture as one score. It reads from the security tools the county already runs: identity, endpoint, monitoring, vulnerability, and staff training.
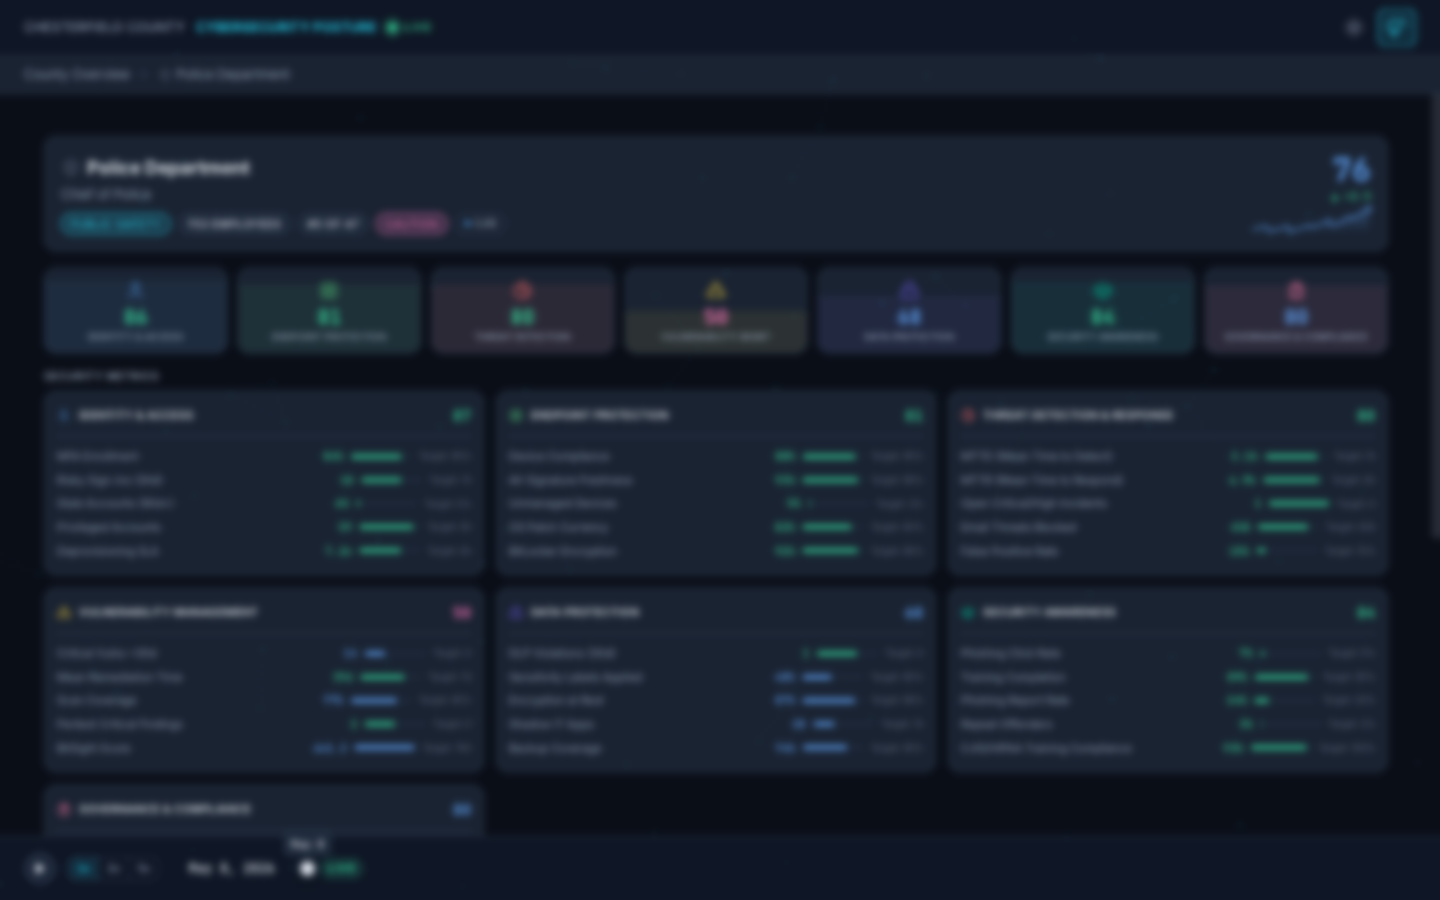
Dozens of metrics come in from those tools. The dashboard puts every metric on the same 0-to-100 scale and grades it against its own green, yellow, and red thresholds. It then weights the pillars into a single county-wide number. The number adds up exactly: an average you can audit, not a hidden formula. Each department’s score is read off the same model, tuned to its own profile.
Readers drill down five levels: county, pillar, department, user or device, and the individual finding. Compliance is not one of the pillars. It is a view across all of them. One switch shows the whole dashboard against the regulation each department must meet.
Bring us a real problem and a real deadline.
Start a conversation- CollectReads from the security tools the county already runs.
- NormalizeEvery metric on the same 0-to-100 scale, graded against its own thresholds.
- WeighPillars weighted into one number that adds up exactly. An average you can audit, not a hidden formula.
- DrillFive levels deep: county, pillar, department, user or device, finding.
ResultA posture report used to take a few weeks to months. It is now live on the dashboard, always.