Multi-site operations · enterprise · 2025
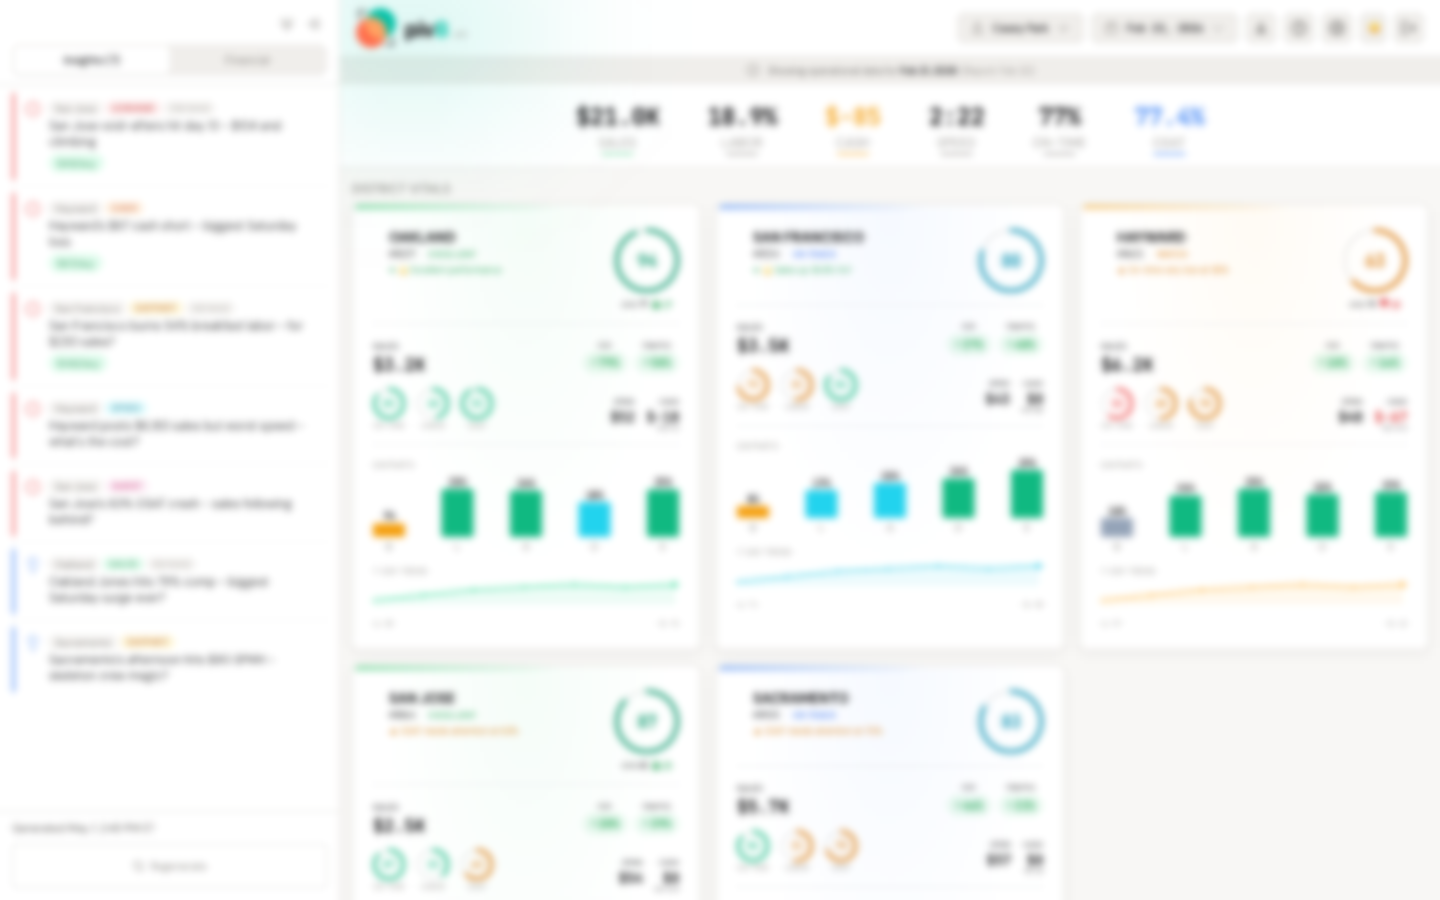
This statistical engine runs across 1,500+ locations. It reads every feed the operator already pays for: transaction, labor, customer satisfaction, vendor, delivery, and business intelligence. Each night it rebuilds those feeds into one modeled warehouse. The warehouse mirrors each operator’s own reports column for column, accurate to within a few percent.
The engine then classifies each operational deviation by what drives it. There are four drivers: structural leakage, local drift, an integrity event, and transient noise.
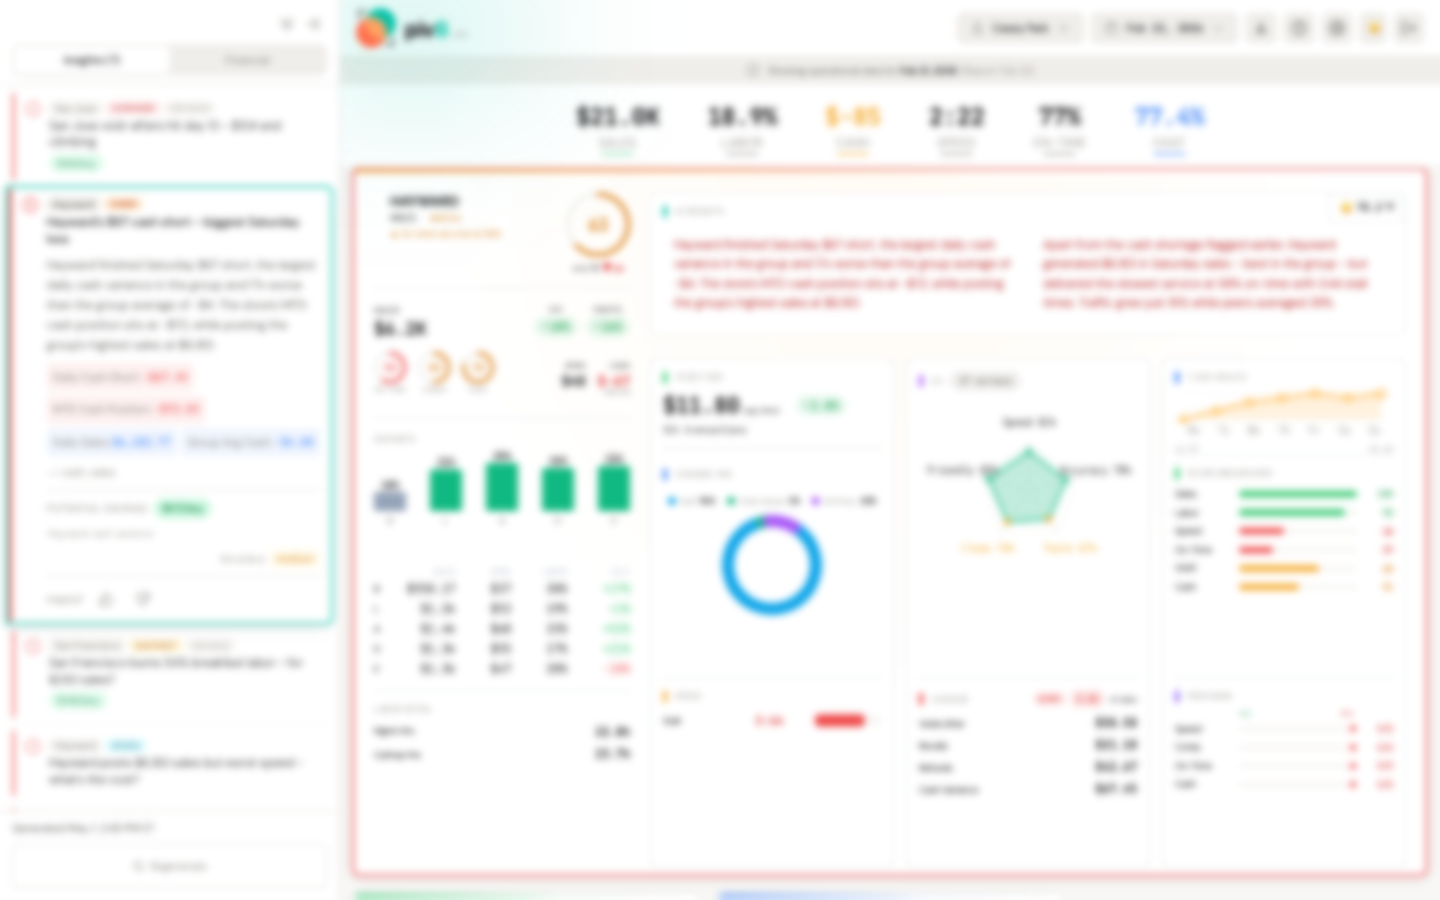
Our proprietary language models turn the numbers into plain findings. Each finding is written three ways. The site operator gets a shift narrative. The area manager gets a regional view. The C-suite gets an executive summary.
Before a finding is shown, the engine checks it against the underlying figures and prices it in recoverable dollars. It also pairs each finding with its strongest counterargument before recommending it.
Bring us a real problem and a real deadline.
Start a conversation- IngestEvery feed the operator already pays for, rebuilt each night into one modeled warehouse.
- ClassifyEach deviation sorted by what drives it: structural leakage, local drift, an integrity event, or transient noise.
- ExplainLanguage models write each finding three ways: for the site, the region, and the C-suite.
- PriceEvery finding checked against the figures and priced in recoverable dollars.
ResultAbout $10,000 recovered per location each year.